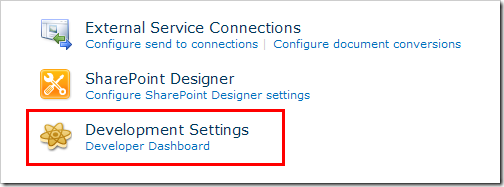
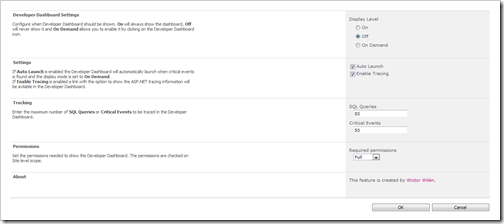
The Developer Dashboard in SharePoint 2010 can be configured using STSADM commands, PowerShell or some coding. To easy turn the Developer Dashboard on and off I have created a Farm scoped feature that allows you to configure the Developer Dashboard from Central Administration > General Application Settings > Development Settings.

The Developer Dashboard contains more configuration options than just to turn it on or off. With this feature you can configure all of the options available for the dashboard:
- Display mode (On, Off, On Demand)
- Auto Launch of Developer Dashboard when critical events is tracked
- Enable the ASP.NET tracing output
- Configure the maximum amount of SQL queries traced
- Configure the maximum amount of critical events traced
- The required permission to view the Developer Dashboard (Full, None or Custom)
If you think this is something you need, and of course you do then you can download the feature here. Extract the ZIP file and install the WSP into your SharePoint 2010 farm!

